
Introducing Cosmos Validator Mission Control
Chainflow and Vitwit are feeling excited to release the Cosmos Validator Mission Control monitoring and alerting dashboard today. It's a free and open-source validator monitoring and alerting dashboard that anyone can use to monitor their Cosmos validator infrastructure. The work was funded by an Interchain Foundation Grant.
The Need
Validator Mission Control is a monitoring and performance dashboard for any Cosmos validator to use. With minimal modification it could be used by any validator operating on a Cosmos SDK-based network.
Larger, well capitalized validator companies use custom-built tools. Smaller validator operators are strapped for time and resources.
Running validator operations leaves smaller operators little time to develop tooling to streamline operations. Streamlining operations frees attention for other activities, such as participating more actively in governance, as well as making themselves more known to the delegator community.
Validator Mission Control frees small validators from manual status checking. It also provides validators an easier way to tweak key parameters to improve performance and security.
Our hope is this will encourage more validator participation. More participation could lead to more equitable stake distribution, as validators can become more involved in other community activities, making themselves more known among the delegator community.
There are a number of open source monitoring tools available. Various validators have provided a variety of monitoring tools as well.
We set out to build a more comprehensive and at the same time user friendly tool than had existed at the time. To encourage adoption, we wanted to streamline the configuration, installation and implementation process as well, to further reduce, rather than increase, the operational burden on validators.
The Solution
Validator Mission Control is a single, comprehensive monitoring and alerting dashboard for Cosmos validator infrastructure. It streamlines validator operations and freeing validators from manual status checking. The tool is easy to install and requires minimal configuration, further reducing validator operational overhead.
Monitoring
Monitoring is provided via three customized Grafana dashboards. The dashboards provide consolidated, user-friendly, yet comprehensive views of a validator infrastucture's health.
Scroll past the dashboard descriptions to find a demo system link to see Validator Mission Control in action 👇
1 - Summary Dashboard
This view provides a quick-look at overall validator and system health.
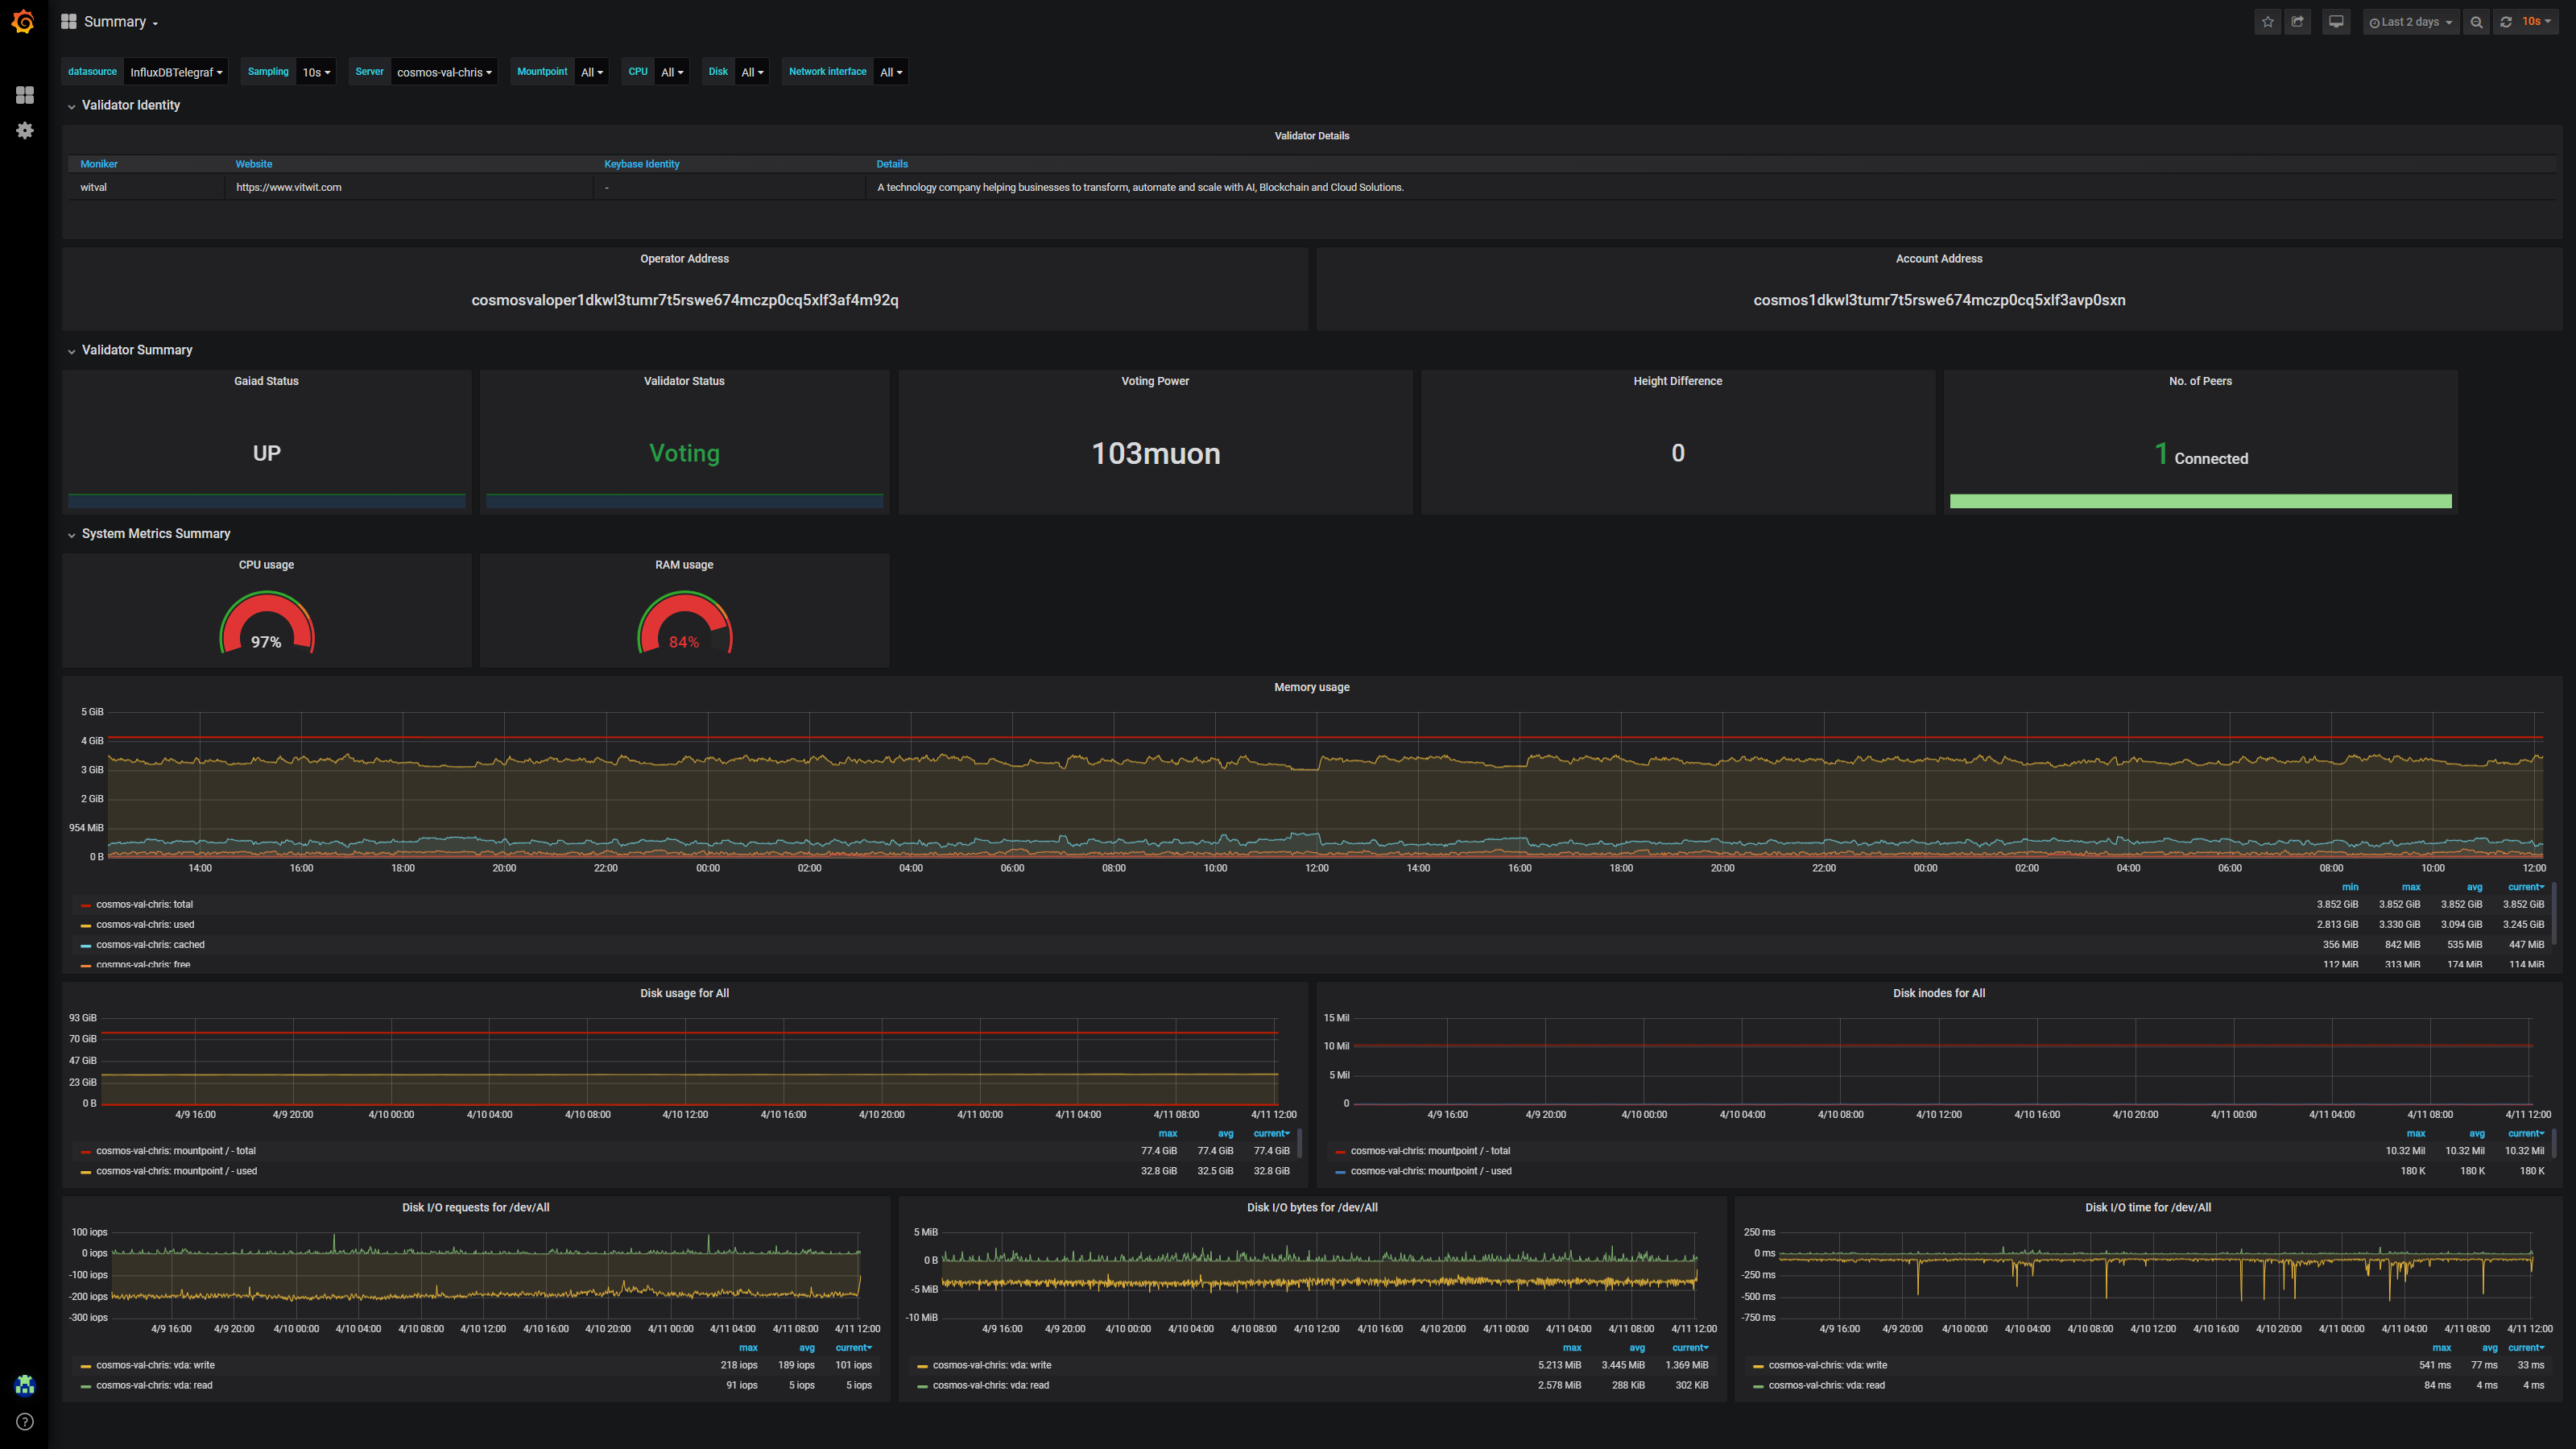
It shows you -
- Your validator's identifying information
- Answers to these key validator health questions
Is gaiad running?
Am I voting?
What's my voting power?
Am I synced to the network?
How many peers do I have?
- Critical system information, providing insight into memory, CPU and disk usage
2 - Validator Monitoring Dashboard
This view provides a comprehensive look at validator details and performance, expanding on the summary dashboard. It also includes proposal information.
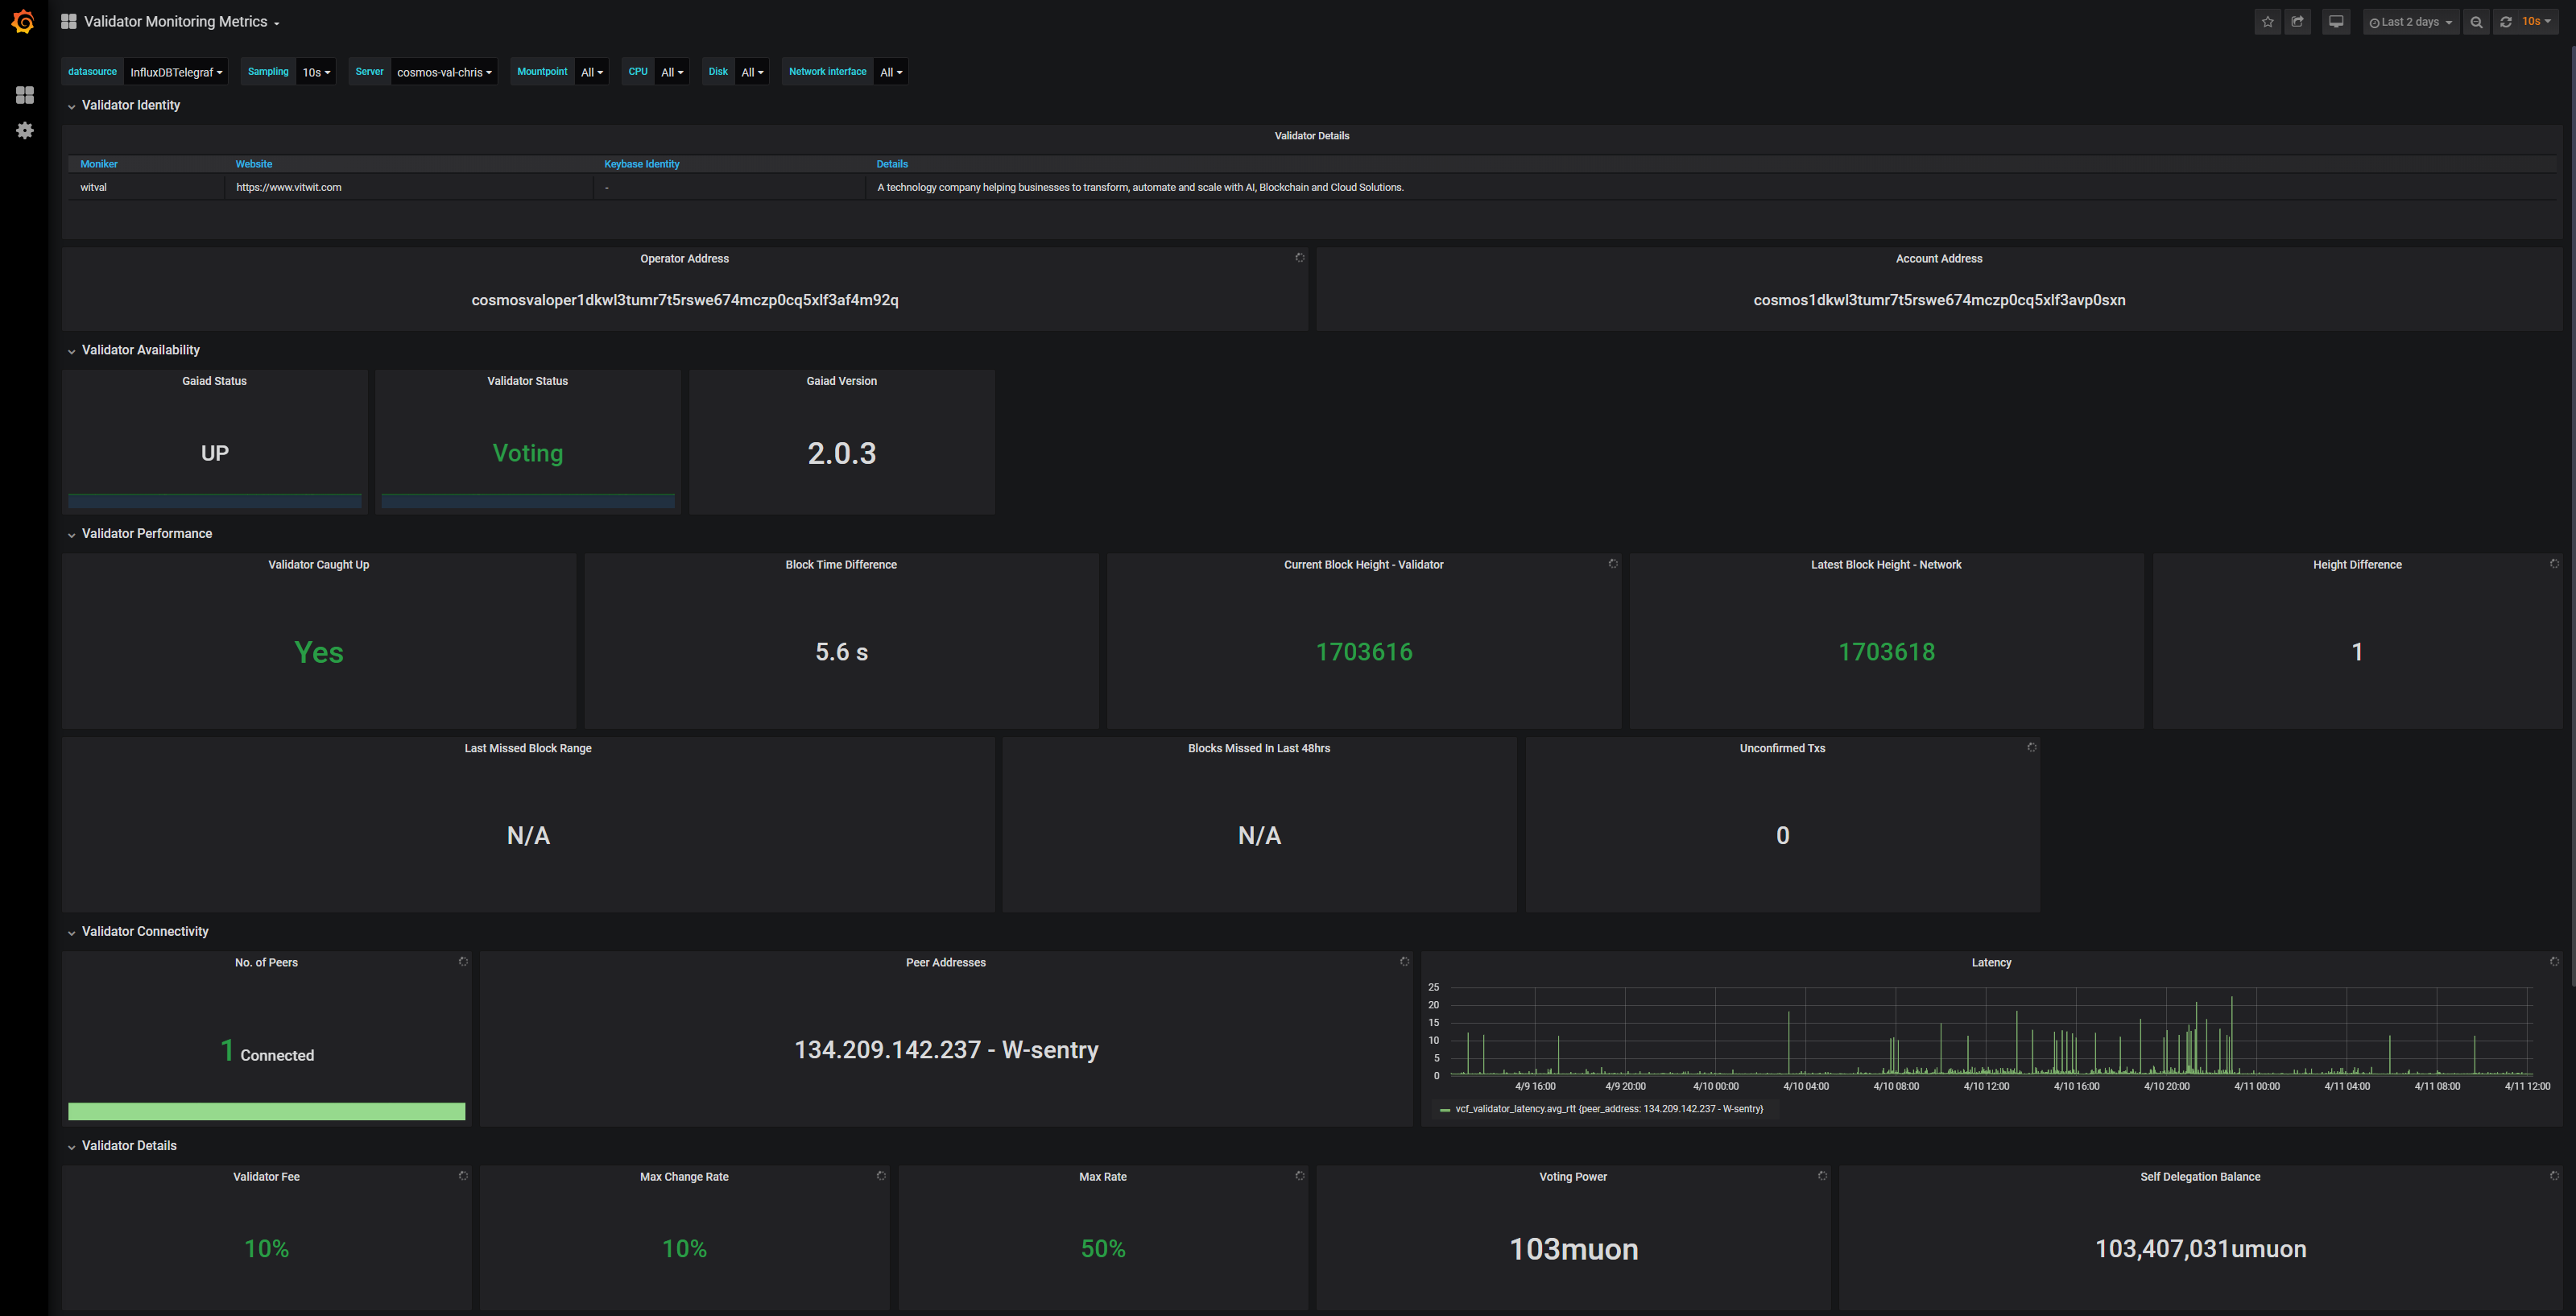
It shows you -
- Validator identity
- Validator availability, including what gaiad version you're running
- Validator Performance, including block time, missed blocks (based on a threshold you configure), and number of unconfirmed transactions in the mempool
- Validator connectivity, including which peers you're connected to and the latency between the validator and each peer
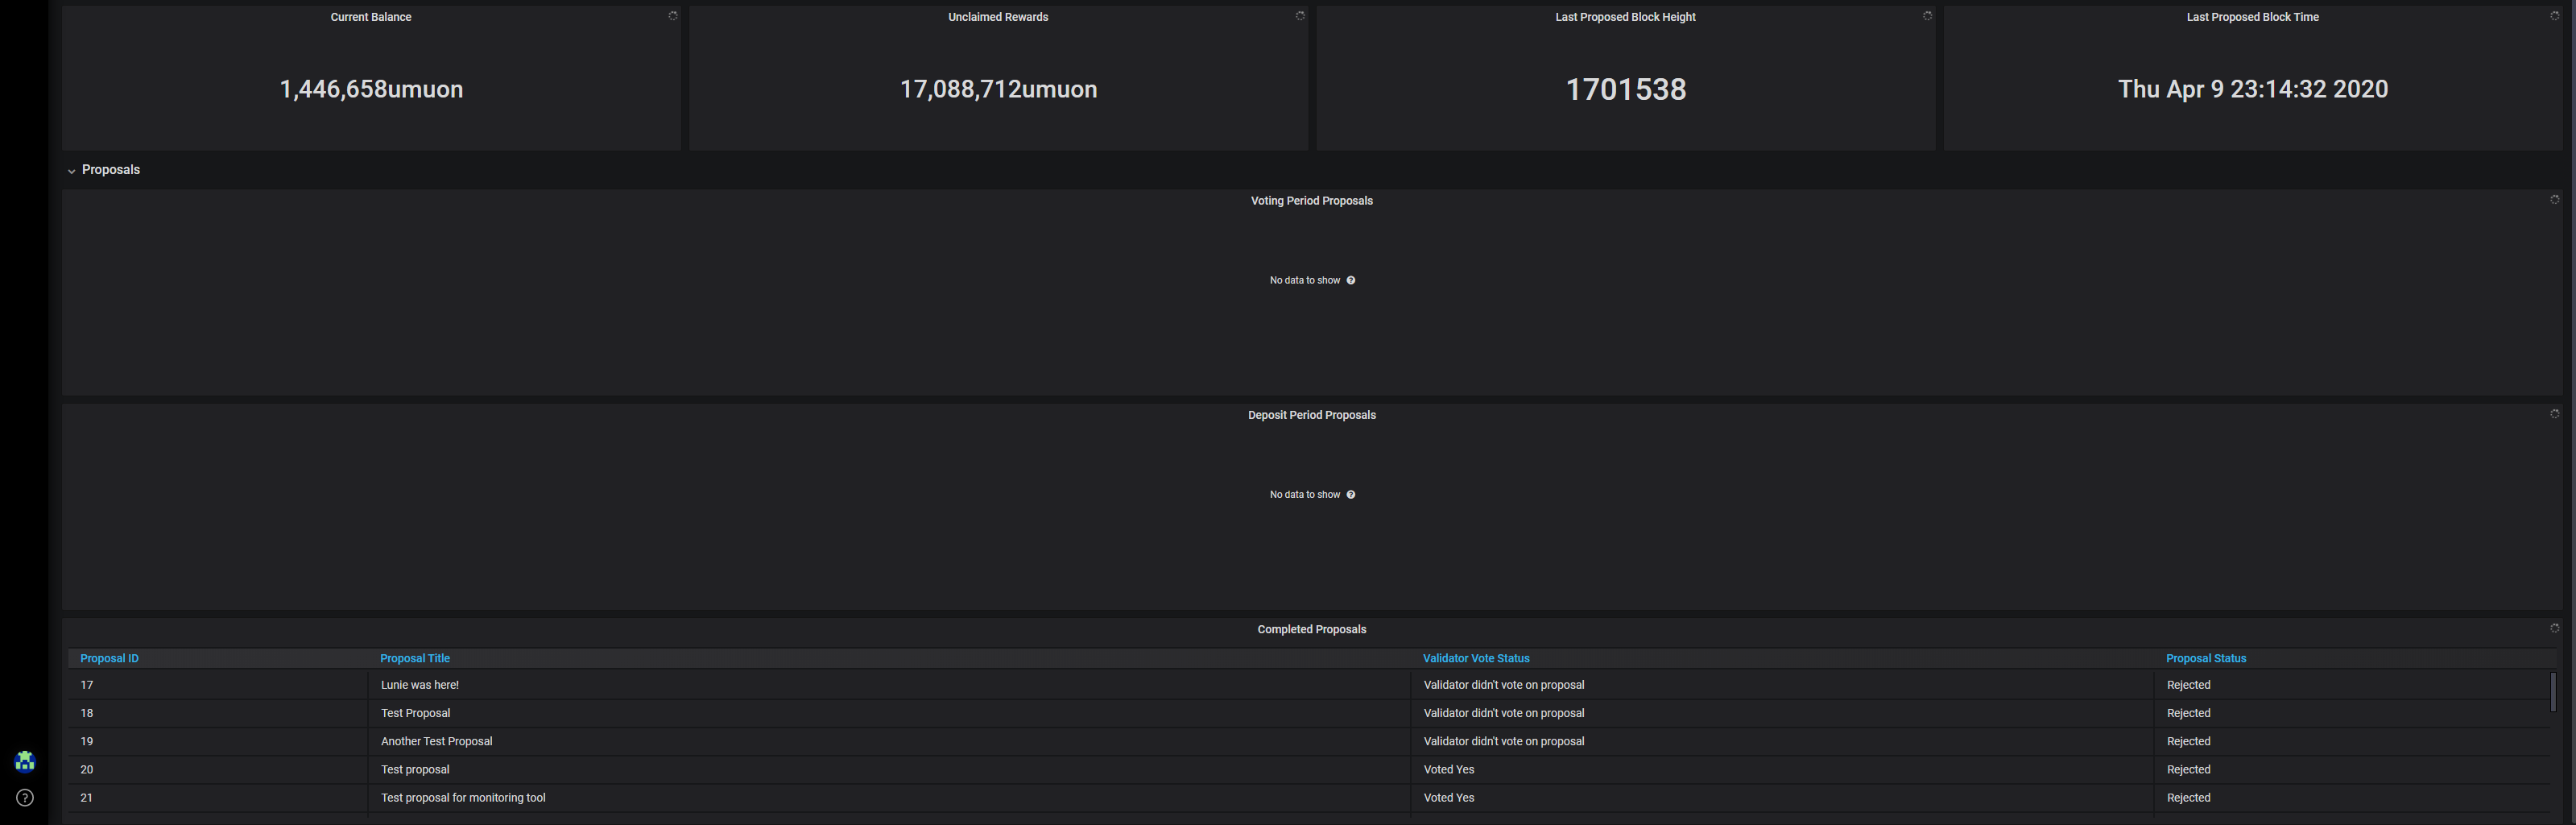
- Proposals, which was a community requested feature. You'll see a list of proposals in each period, e.g. deposit, voting, completed, as well whether or not you participated in each period.
3 - System Monitoring Dashboard
This view provides a comprehensive look at system performance metrics, expanding on the summary dashboard. Here's you'll find all the system metrics you'd expect to see in a comprehensive system monitoring tool.
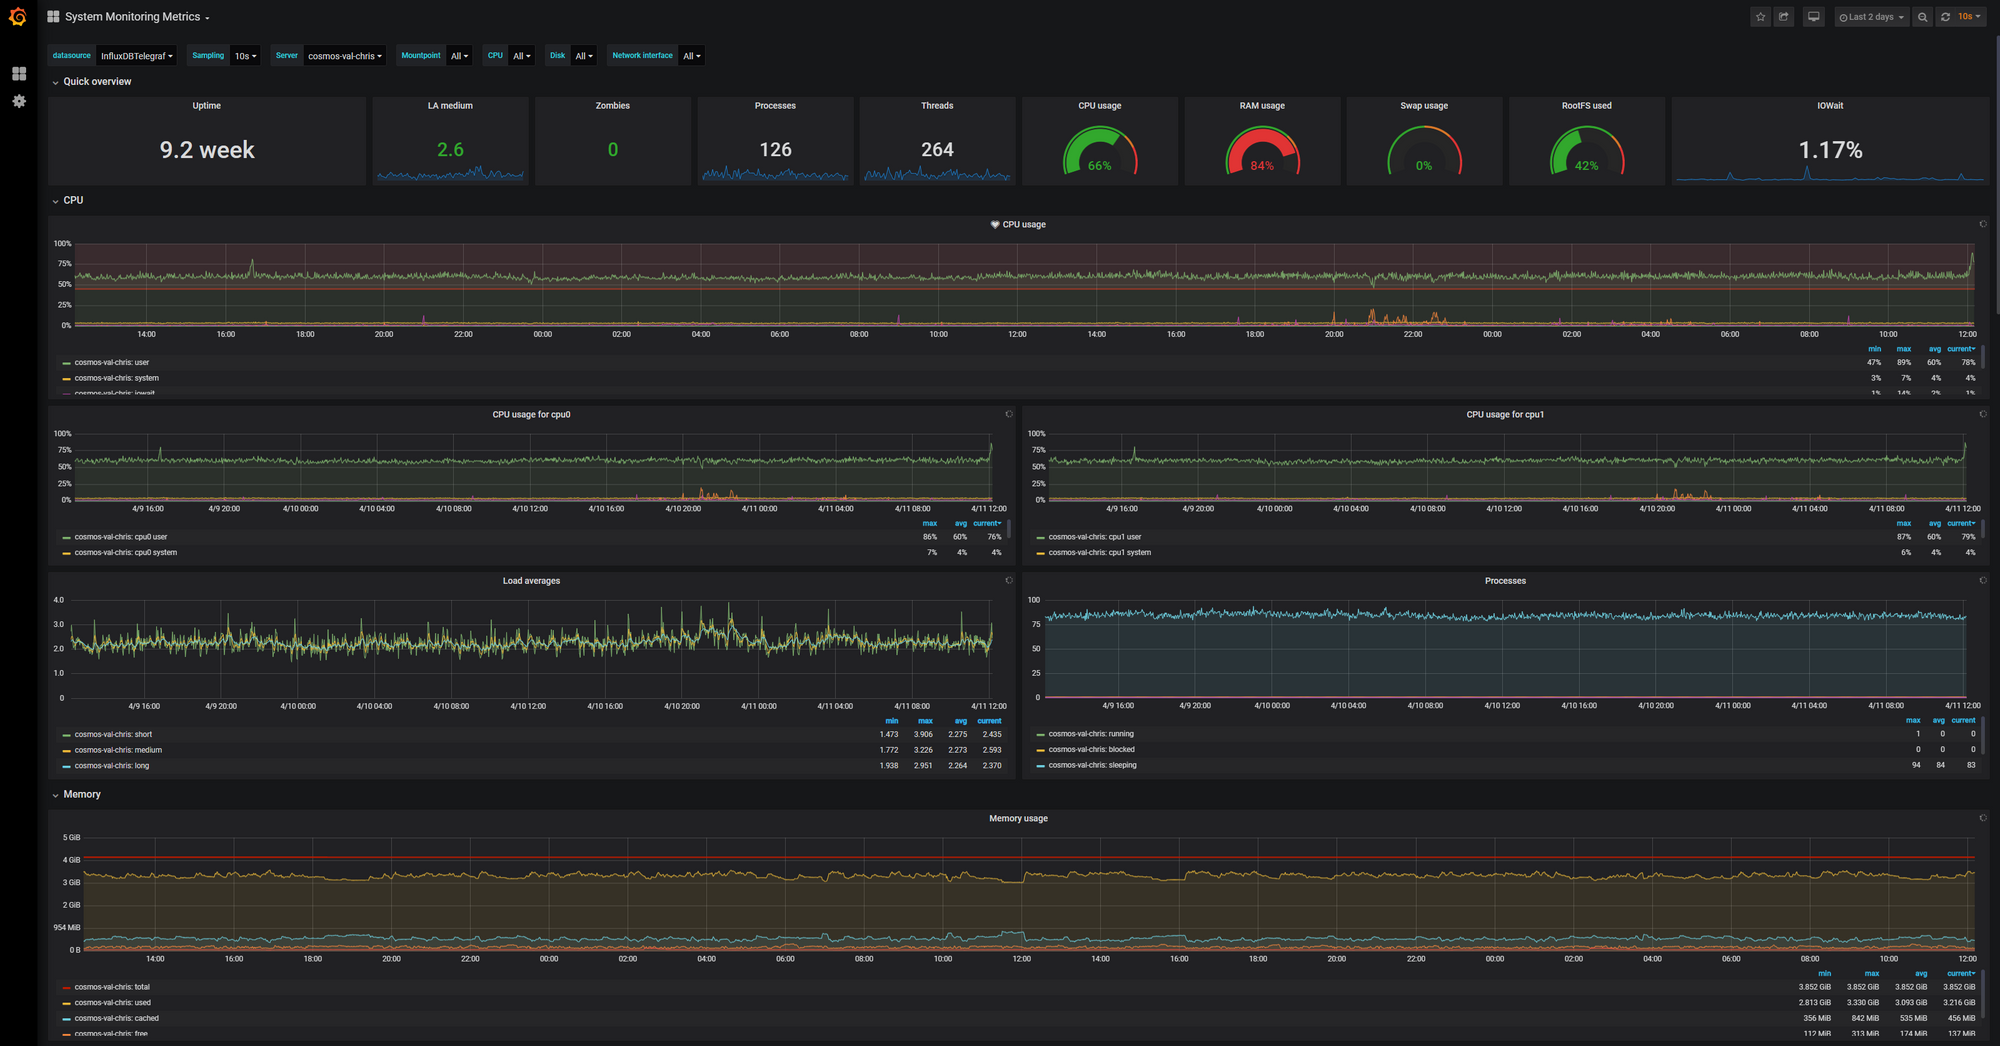
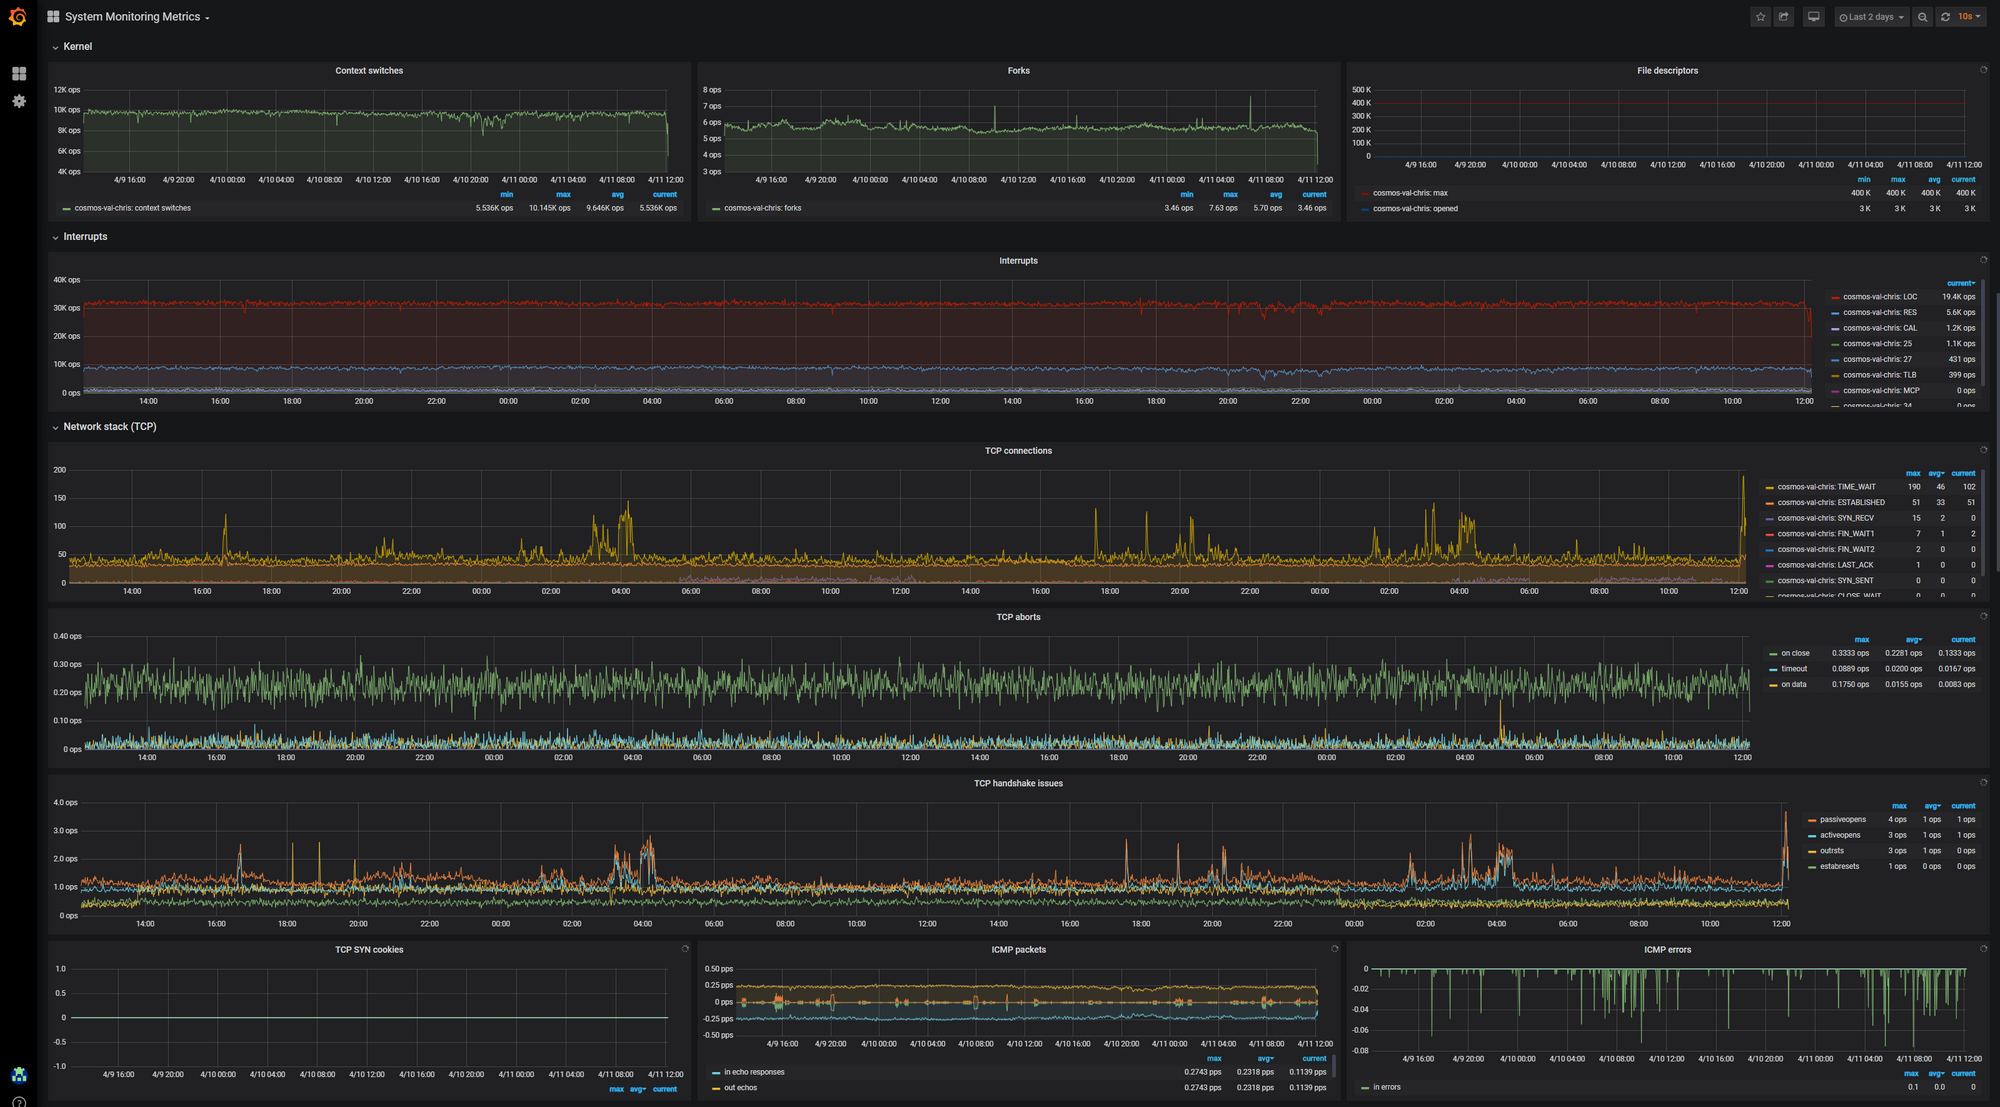
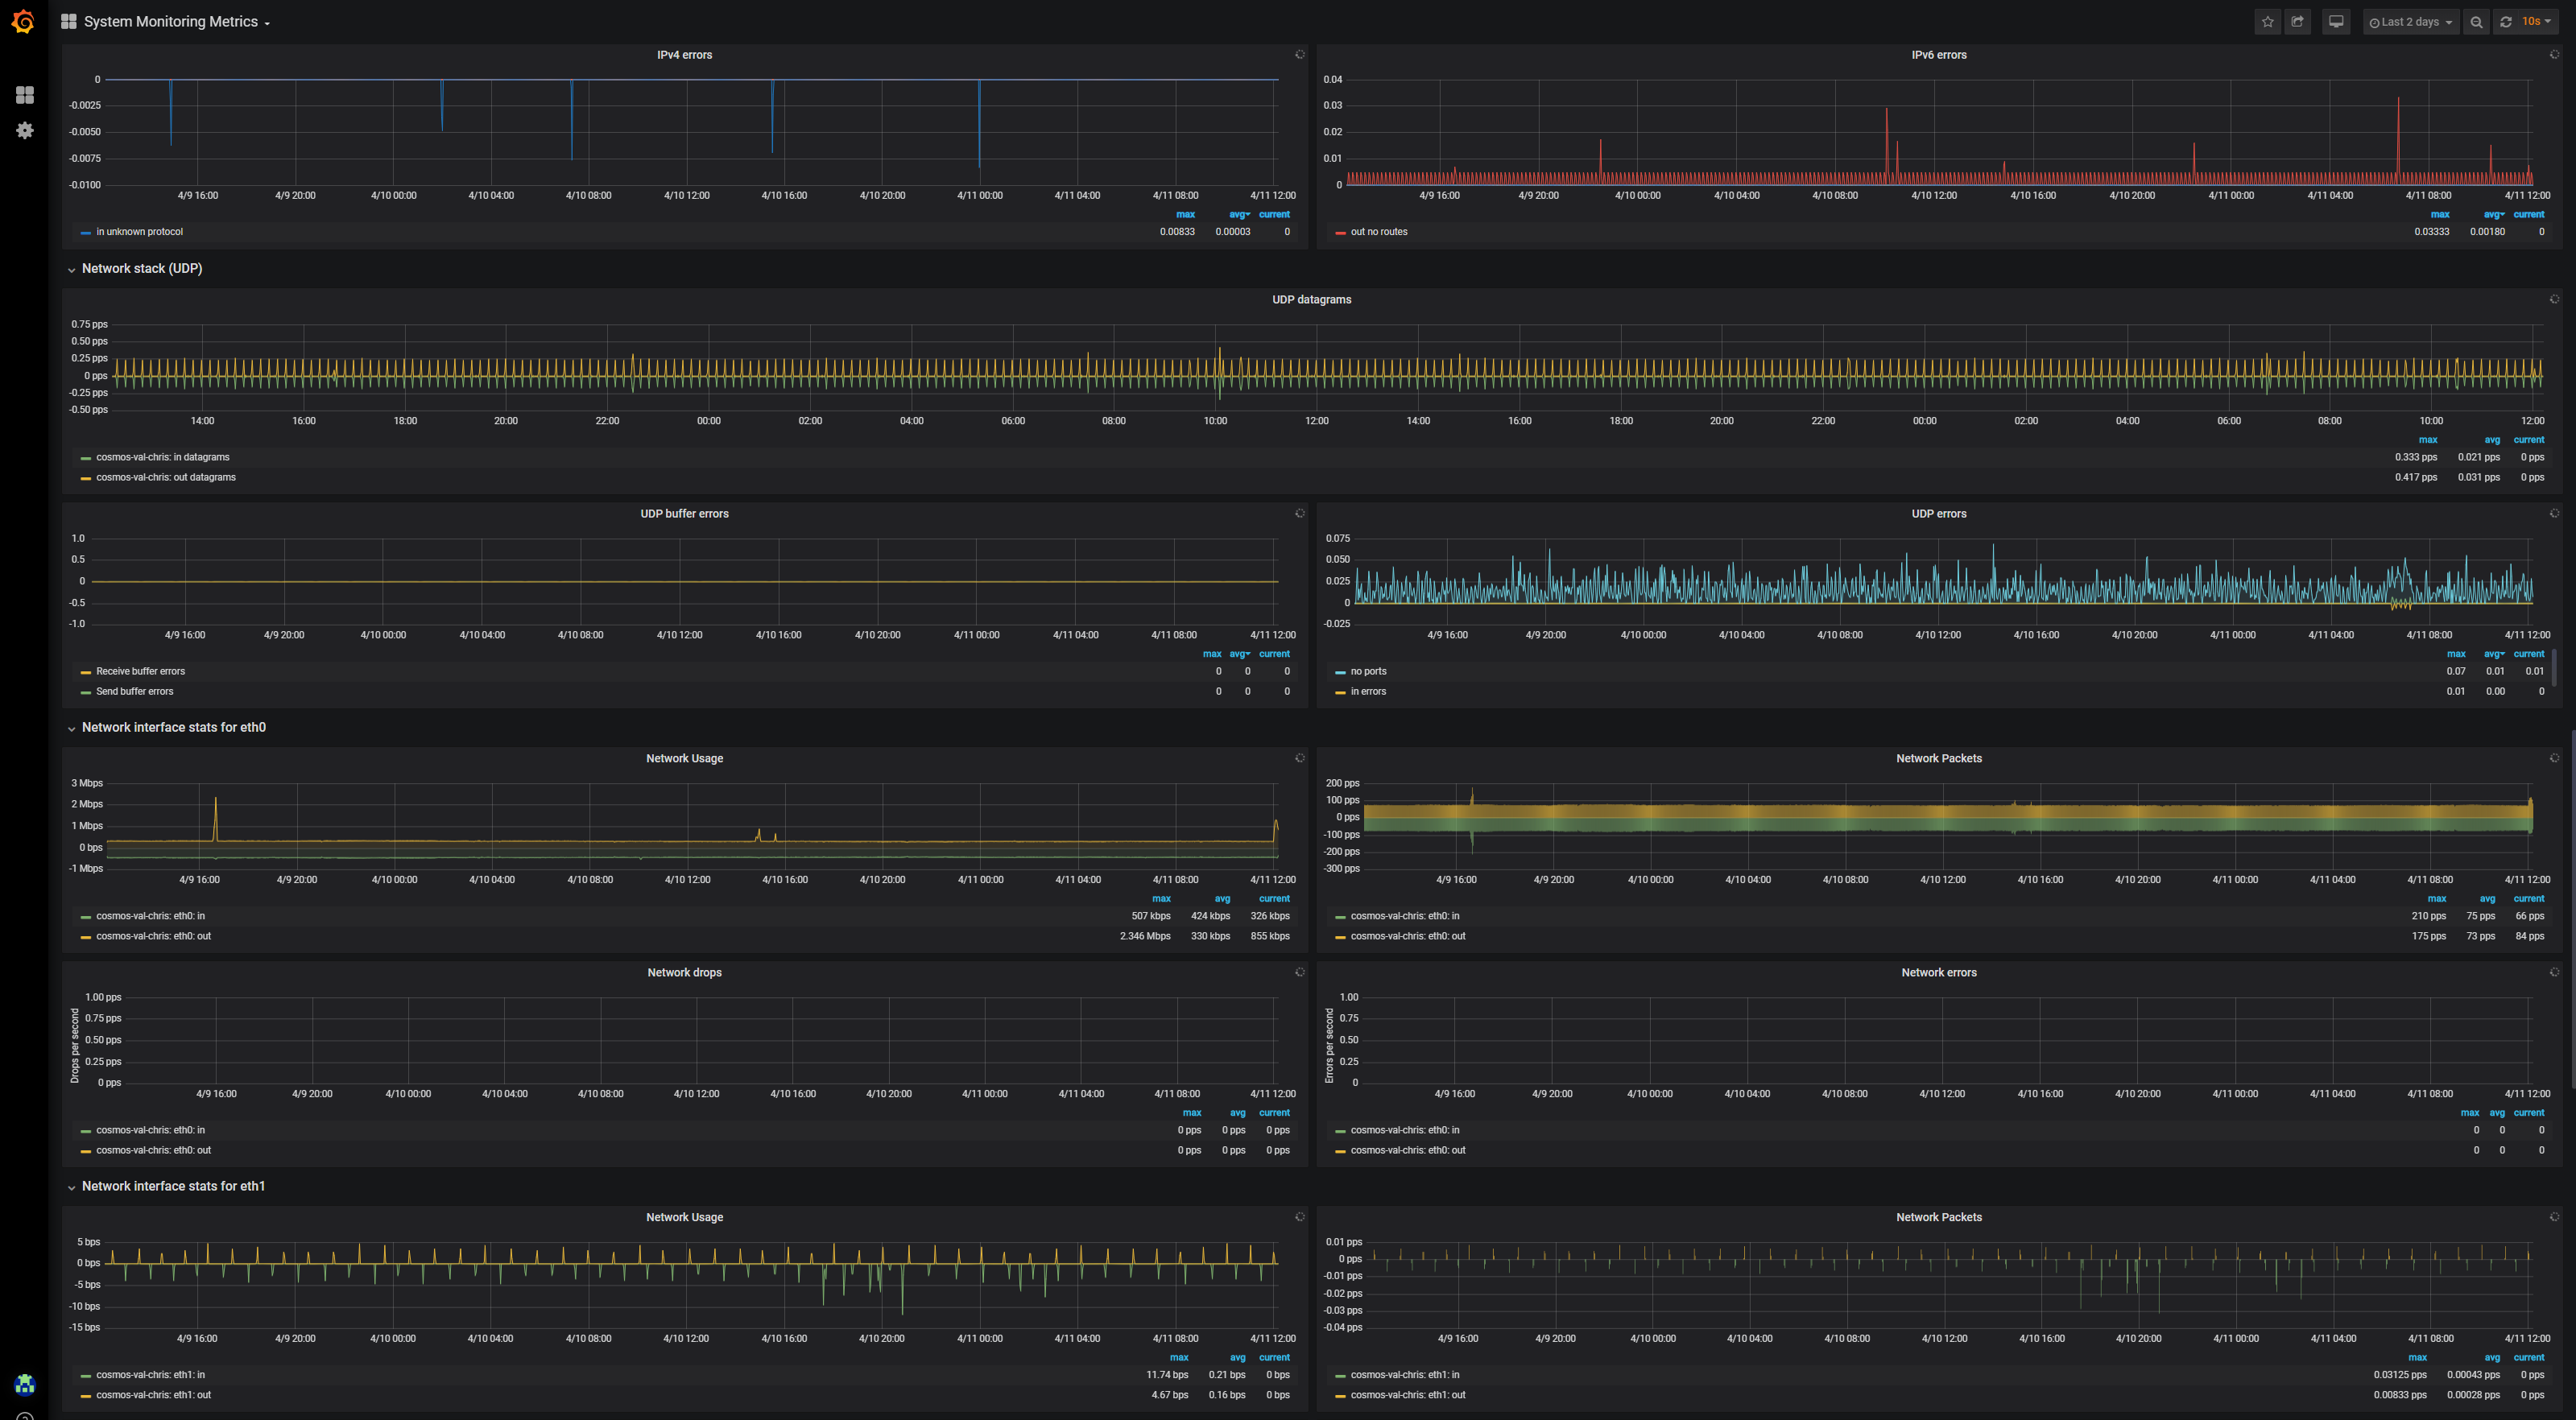
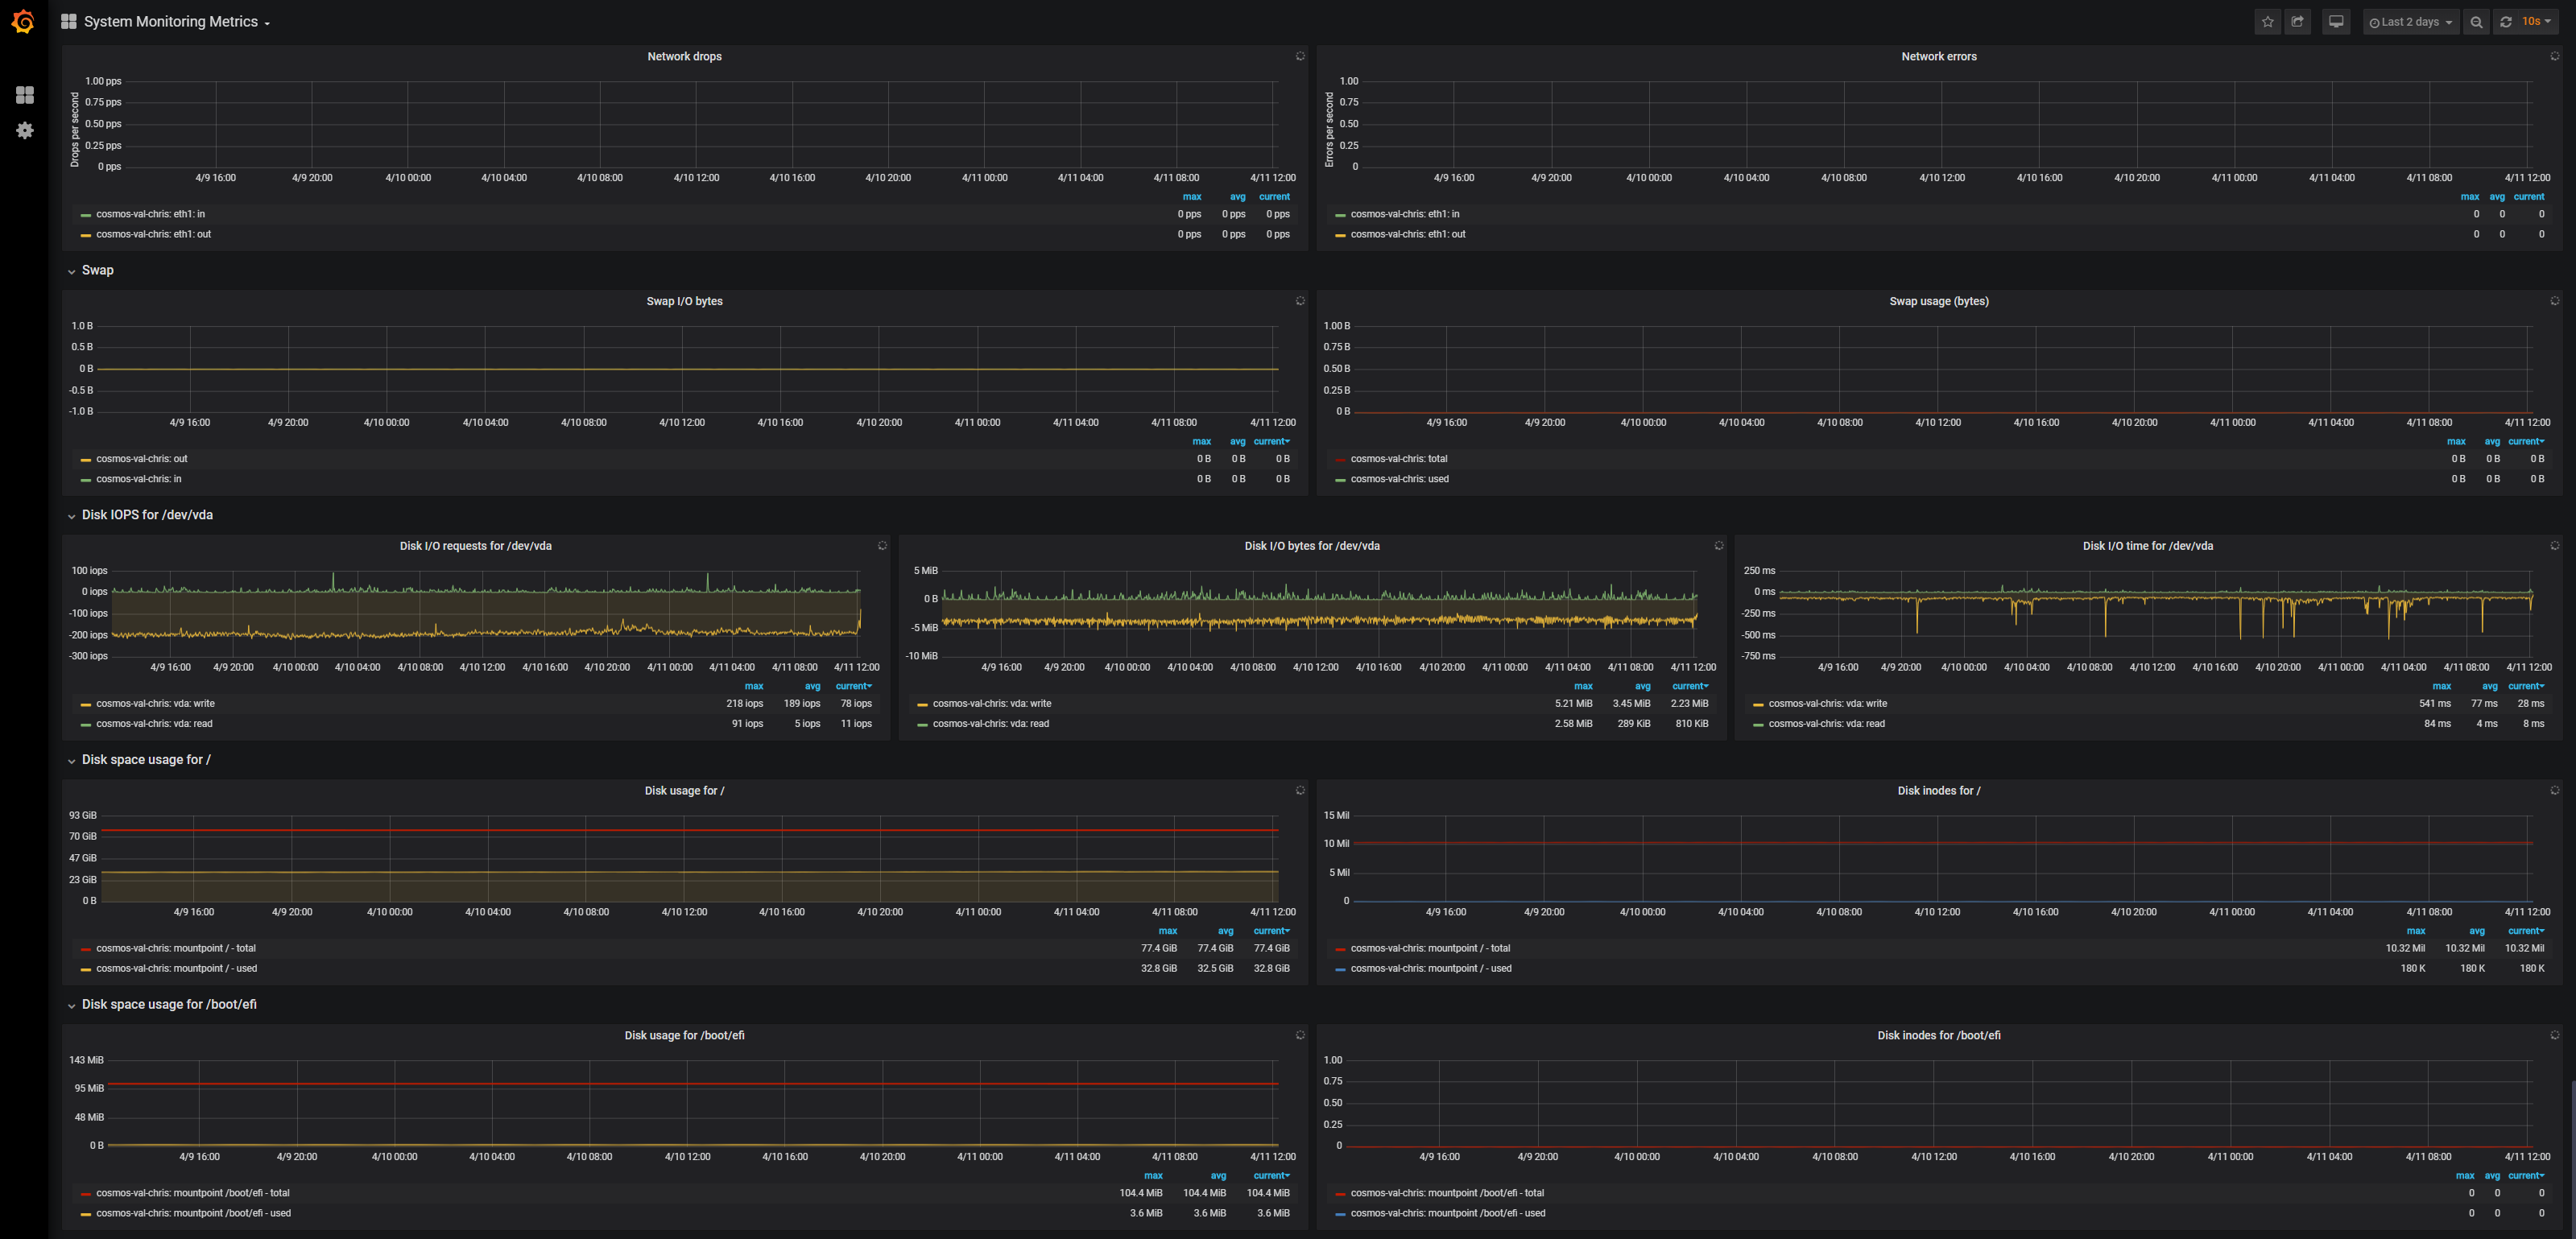

It shows you -
- CPU usage
- Memory usage
- Kernel performance
- Interrupts
- Network stack information (TCP/UDP)
- Network interface information
- Disk IOPS
- Disk space usage
- Metric velocity
Alerting
A custom-built alerting module complements the dashboards. The module provides configurable alerting that send warnings and alarms, when the validator systems and/or connectivity within the infrastructure experience issues.
The alerts are sent to a Telegram channel or email. Validators can update the code to send the alerts to any other communication channel you prefer.
Validator Mission Control focuses on providing helpful alerts, while not including superfluous alerts that cause unnecessary noise. You can find the code for alerting module here.
Here's the full list of alerts -
1 Availability
1.1 Server available and reachable - Alert if unreachable
1.2 Gaiad running - Alert if Gaiad stops
1.3 Validator active, i.e. not jailed - Alert if validator's jailed
2 Performance
2.1. Disk utilization - Alert if 70% is exceeded
2.3 CPU utilization - Alert if 70% is exceeded
2.4 RAM utilization - Alert if 95% is exceeded
3 Validator performance
3.3 Caught-up? - Alert if node is not synced
3.4 Validator voting? - Alert if validator not voting
3.5 Missed blocks - Alert if block threshold is exceeded, currently 4 blocks for testing purposes
4 Connectivity
4.1. Number of peers - Alert if number of peers drops below a threshold, currently 1 for testing purposes
5 Validator details
5.1 Voting power - Alert if voting power drops below a threshold, currently 50 for testing purposes
6 Proposals
6.1 New proposal - Alert if new proposal is created
6.2 Proposal voting period and period expiration date - Alerts when proposal enters deposit period, voting period, is passed or rejected
6.3 Validator voting status - Alert if validator hasn't voted within 24 hours of voting period expiration
Responding to the Community
The Cosmos community provided two rounds of feedback.
The first round was in response to the original specification published here. One takeaway from that round was the importance of proposal monitoring and alerting, which was subsequently implemented, as described above.
The second response was in response to an initial review provided by Ztake, POS Bakerz and Staking Facilities. The round resulted in the Summary dashboard creation, display element reorganization, and adding the number of unconfirmed mempool transactions.
The broader call for prototype feedback didn't yield actionable feedback. Because of this, feedback will continue to be collected for a to-be-determined period of time.
Now that the tool is released, assuming use of the tool will spark additional ideas. An updated tool version will be released, once the community has a chance to try the tool for themselves.
Getting Started
You can find installation and implementation instructions here.
Please address any questions or feedback you may have, including feature requests here or the Chainflow Telegram group.