
Introducing Solana Mission Control
Chainflow and Vitwit are feeling excited to release the Solana Validator Mission Control monitoring and alerting dashboard today. It's a free and open-source validator monitoring and alerting dashboard that anyone can use to monitor their Solana validator infrastructure. The work was funded by a Solana Foundation Grant.
The Need
Validator Mission Control is a monitoring and performance dashboard for any Solana validator to use.
Larger, well capitalized validator companies use custom-built tools. Smaller validator operators are strapped for time and resources. With over 800 validators and more being added each day, it's likely that a good number of operators will be on the smaller side and benefit from open source tools like this.
Running validator operations leaves smaller operators little time to develop tooling to streamline operations. Streamlining operations frees attention for other activities, such as participating more actively in governance, as well as making themselves more known to the delegator community.
Validator Mission Control frees small validators from manual status checking. It also provides validators an easier way to tweak key parameters to improve performance and security.
Our hope is this will encourage more validator participation. More participation could lead to more equitable stake distribution, as validators can become more involved in other community activities, making themselves more known among the delegator community.
While there are a number of open source monitoring tools available, we set out to build a more comprehensive and at the same time user friendly tool than had existed at the time.
To encourage adoption, we wanted to streamline the configuration, installation and implementation process as well, to further reduce, rather than increase, the operational burden on validators.
The Solution
Validator Mission Control is a single, comprehensive monitoring and alerting dashboard for Solana validator infrastructure. It streamlines validator operations and frees validators from manual status checking. The tool is easy to install and requires minimal configuration, further reducing validator operational overhead.
Monitoring
Monitoring is provided via three customized Grafana dashboards. The dashboards provide consolidated, user-friendly, yet comprehensive views of a validator infrastucture's health.
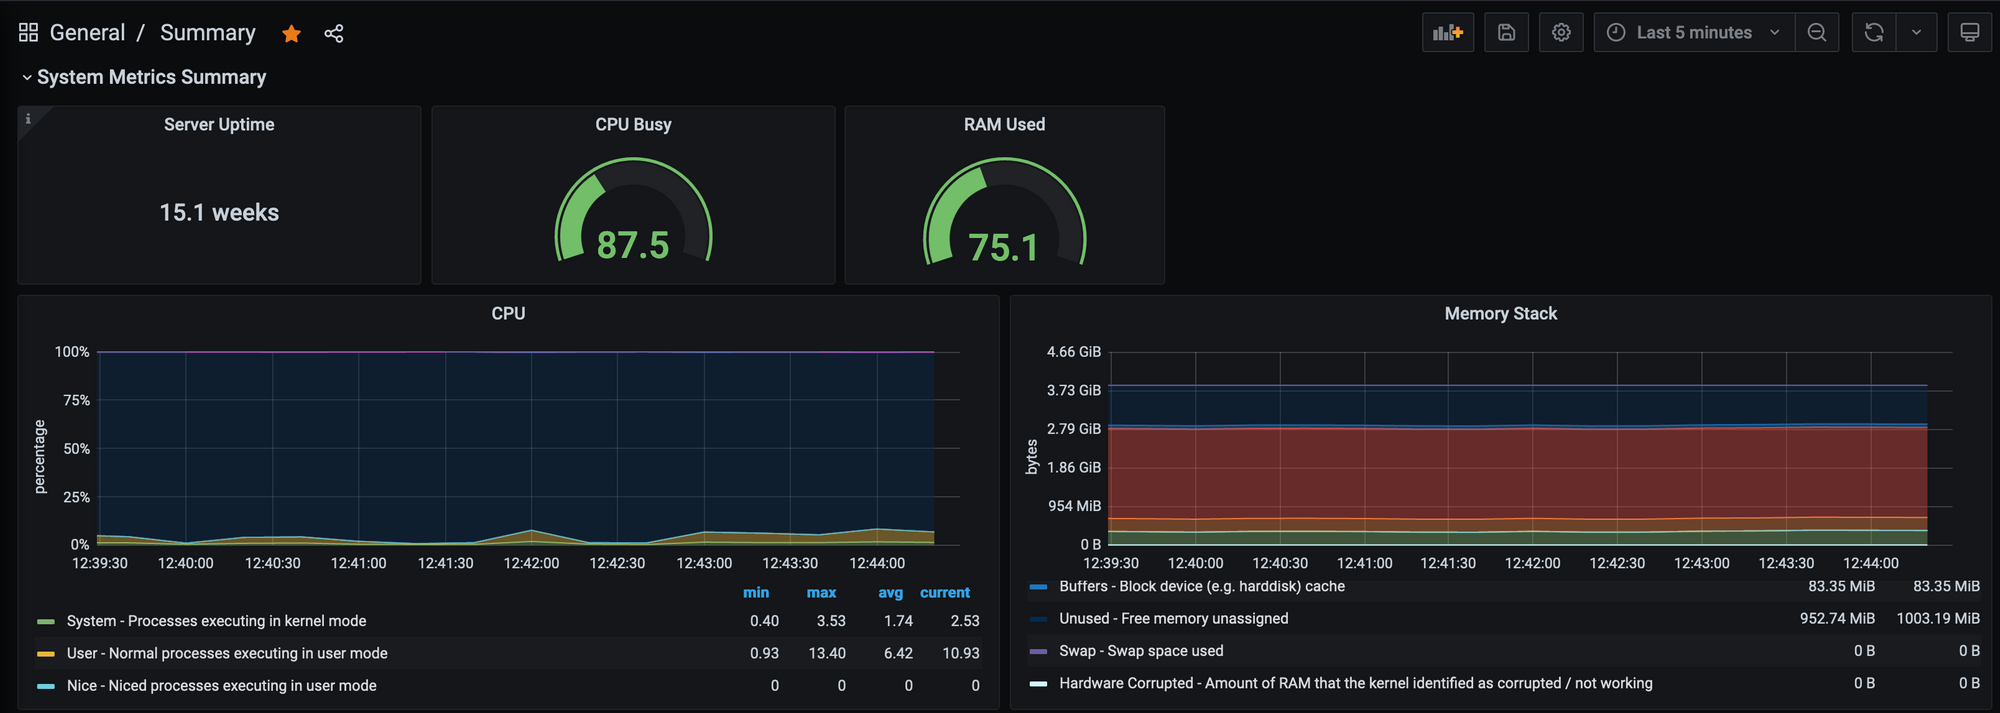
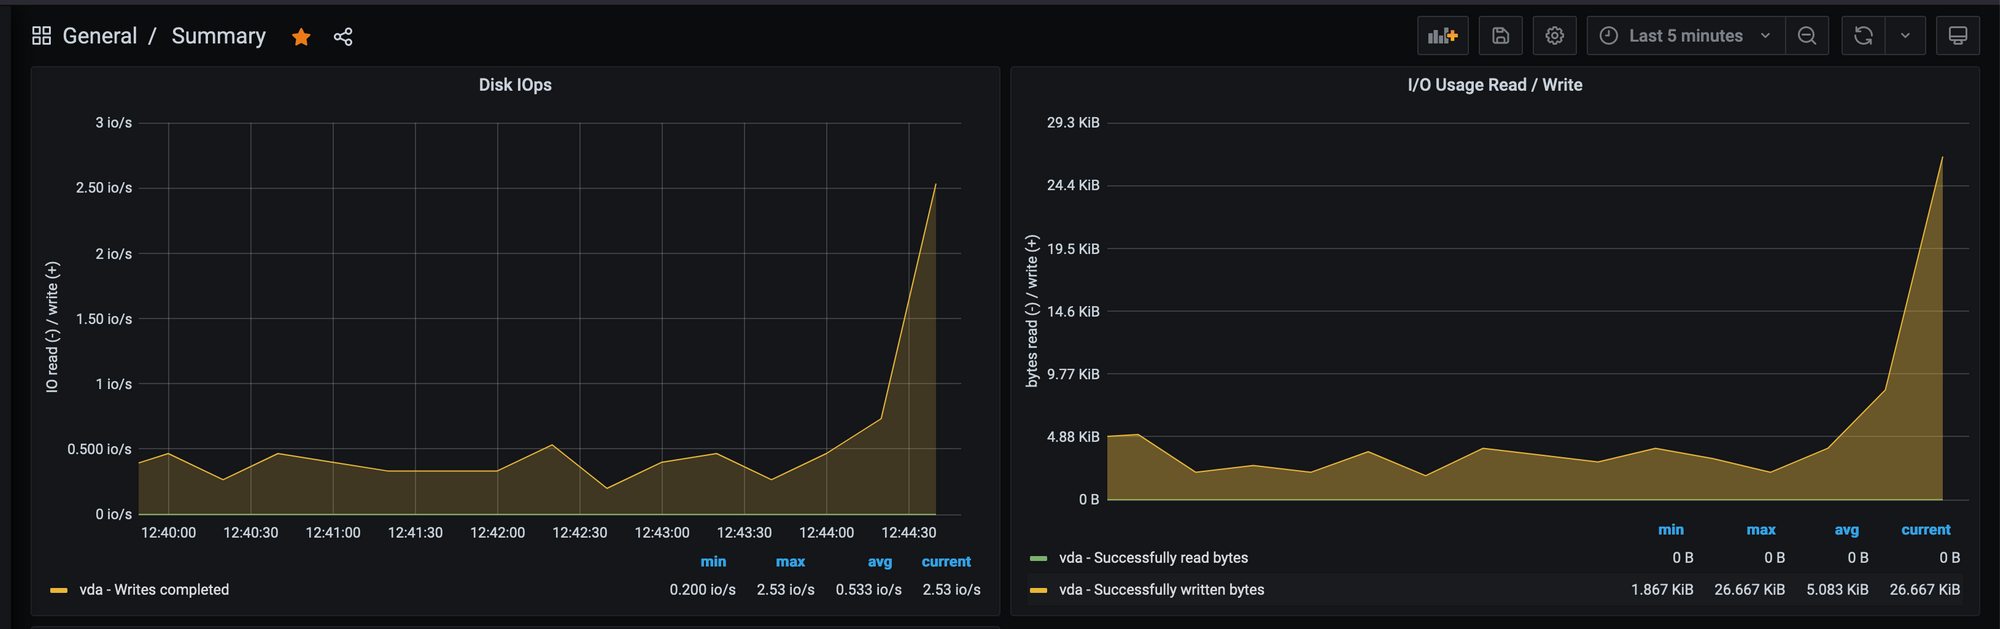
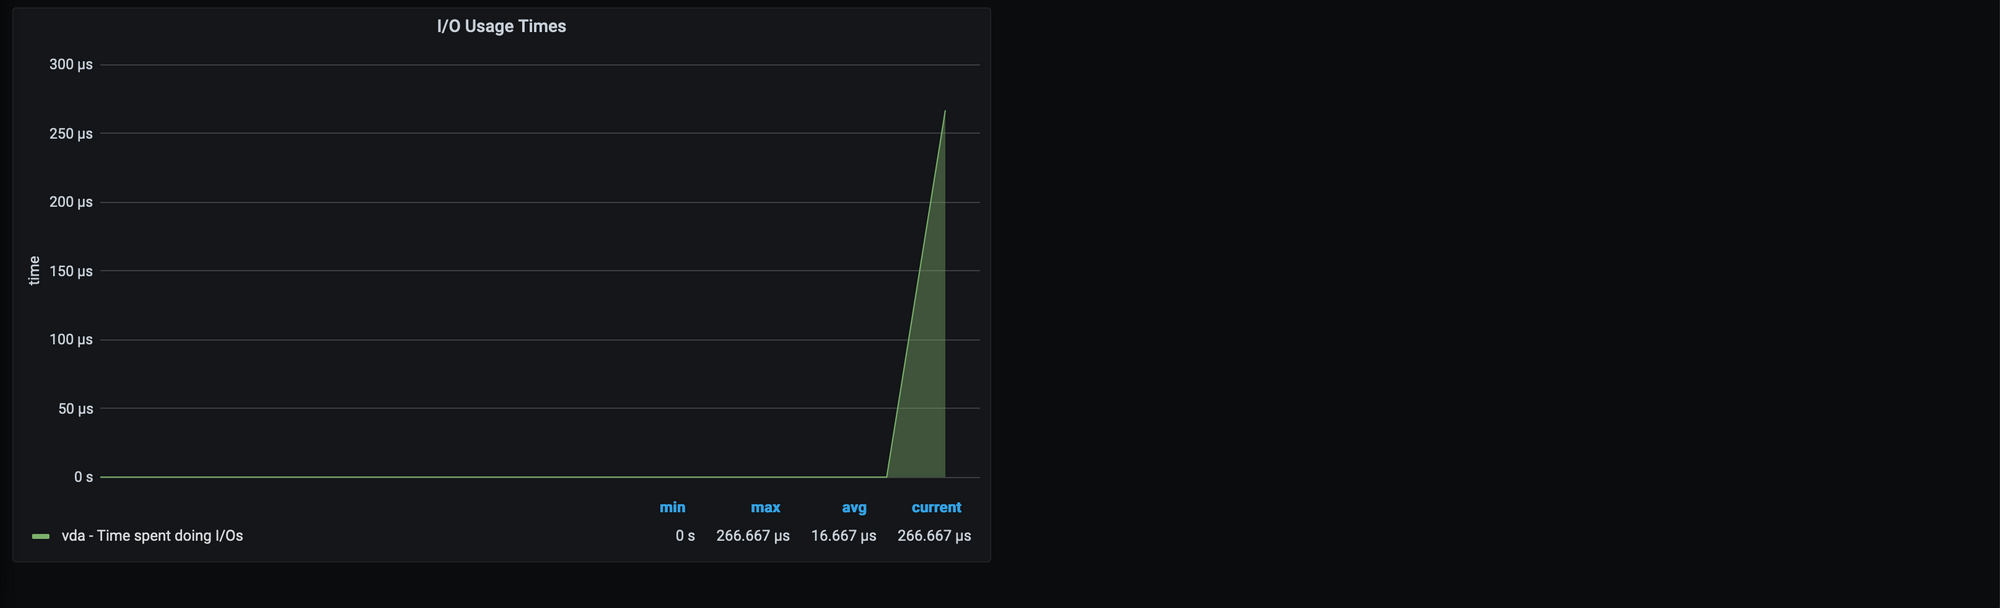
1 - Summary Dashboard
This view provides a quick-look at overall validator and system health.
It shows you -
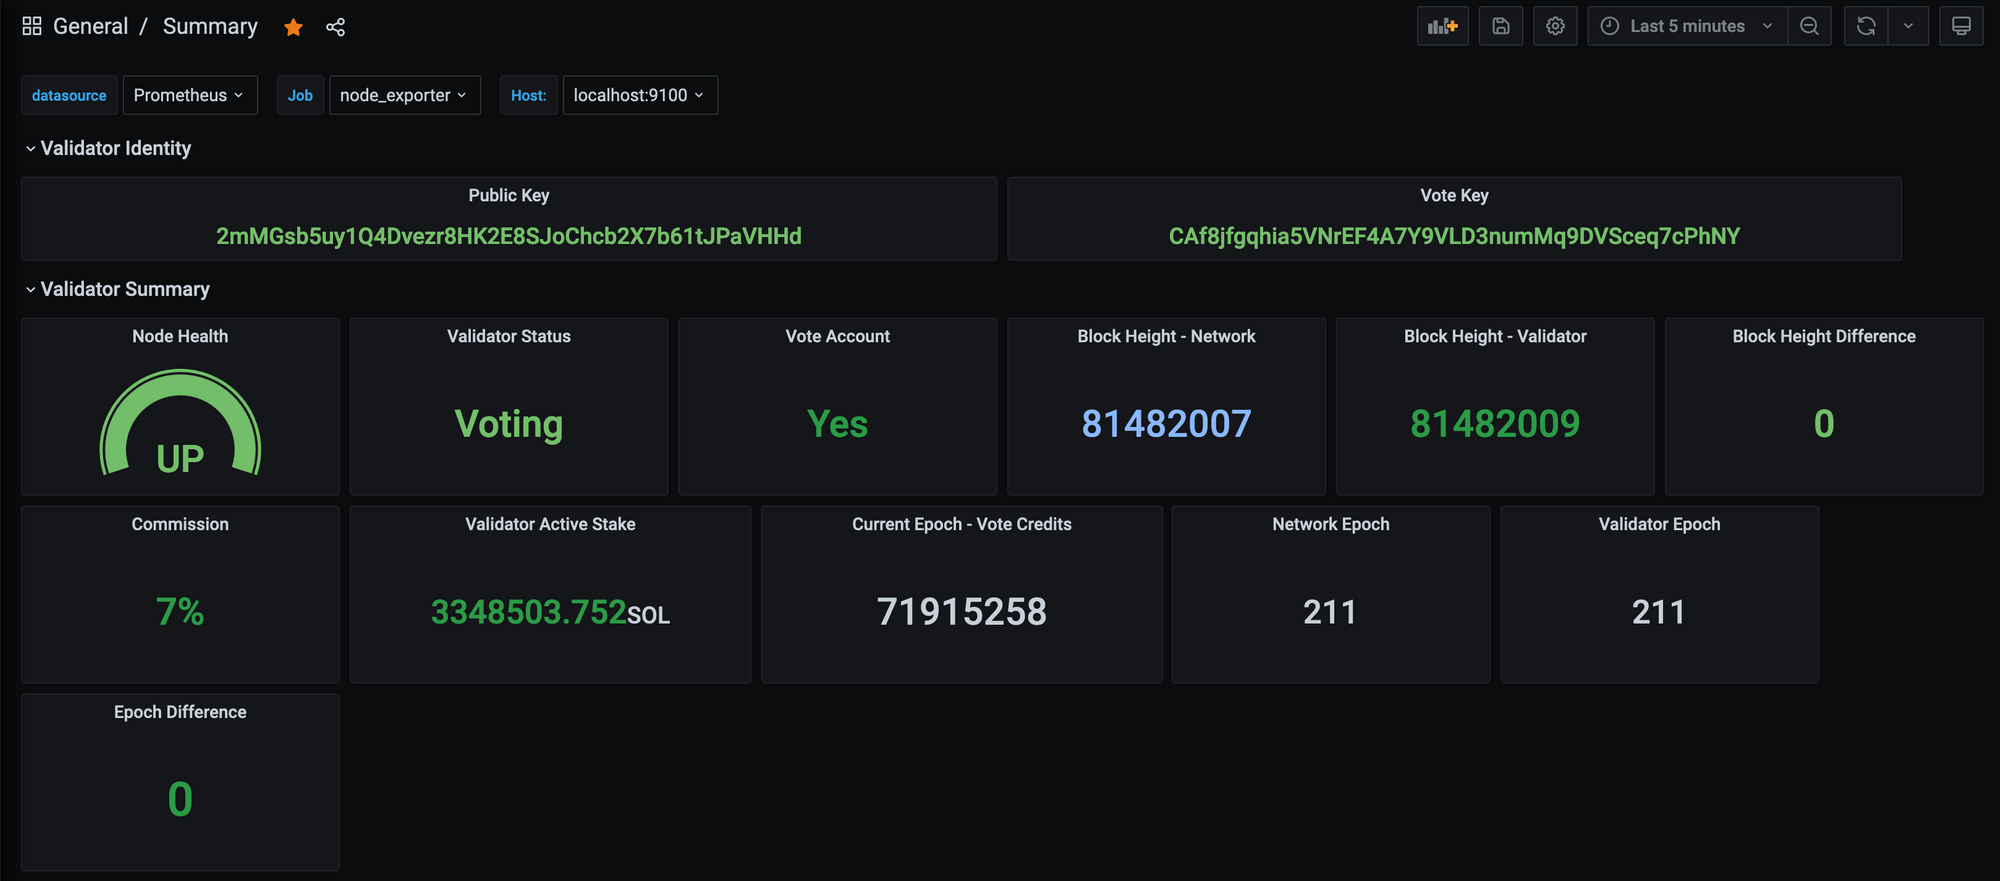
- Your validator's identifying information
- Answers to these key validator health questions 👇
Is our Solana validator running?
Is our Solana validator voting?
Is our Solana validator caught up to the network (epock and block)?
What's our validator's active stake total and commission?
- Critical system information, providing insight into CPU, memory, network and disk usage
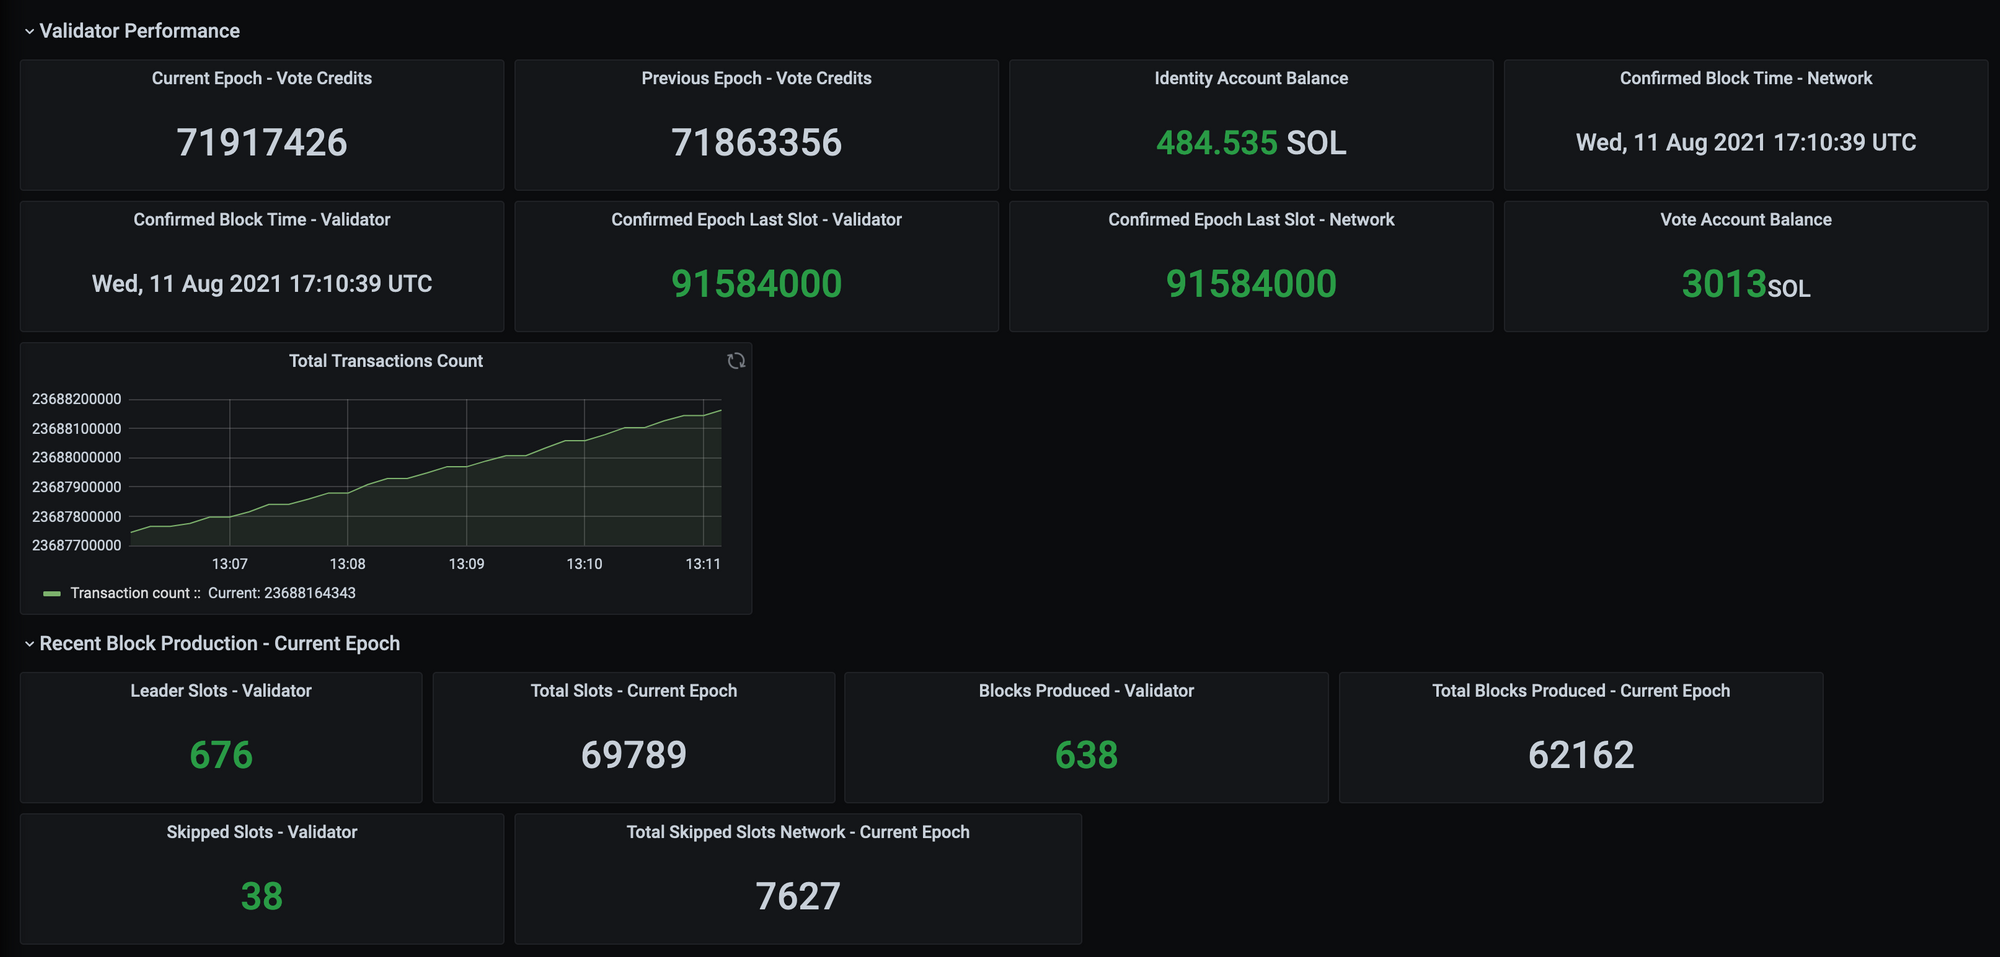
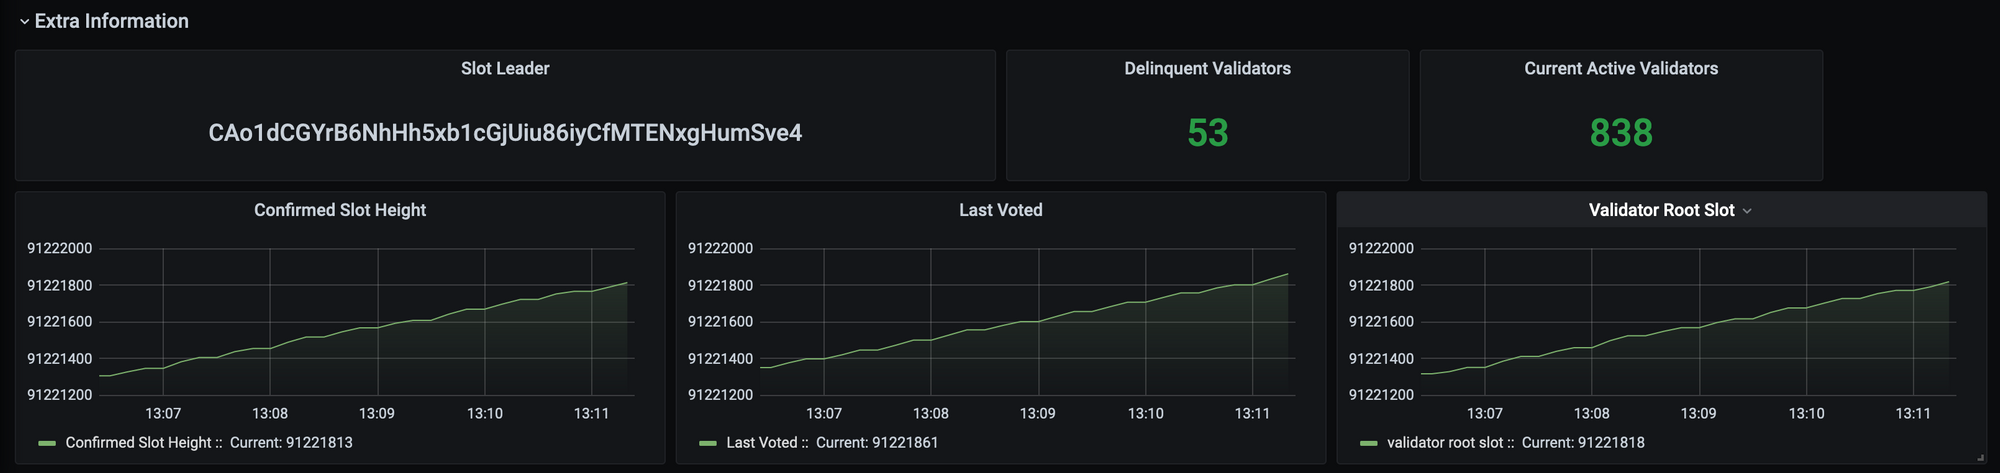
2 - Validator Monitoring Dashboard
This view provides a comprehensive look at validator details and performance, expanding on the summary dashboard.
It shows you -
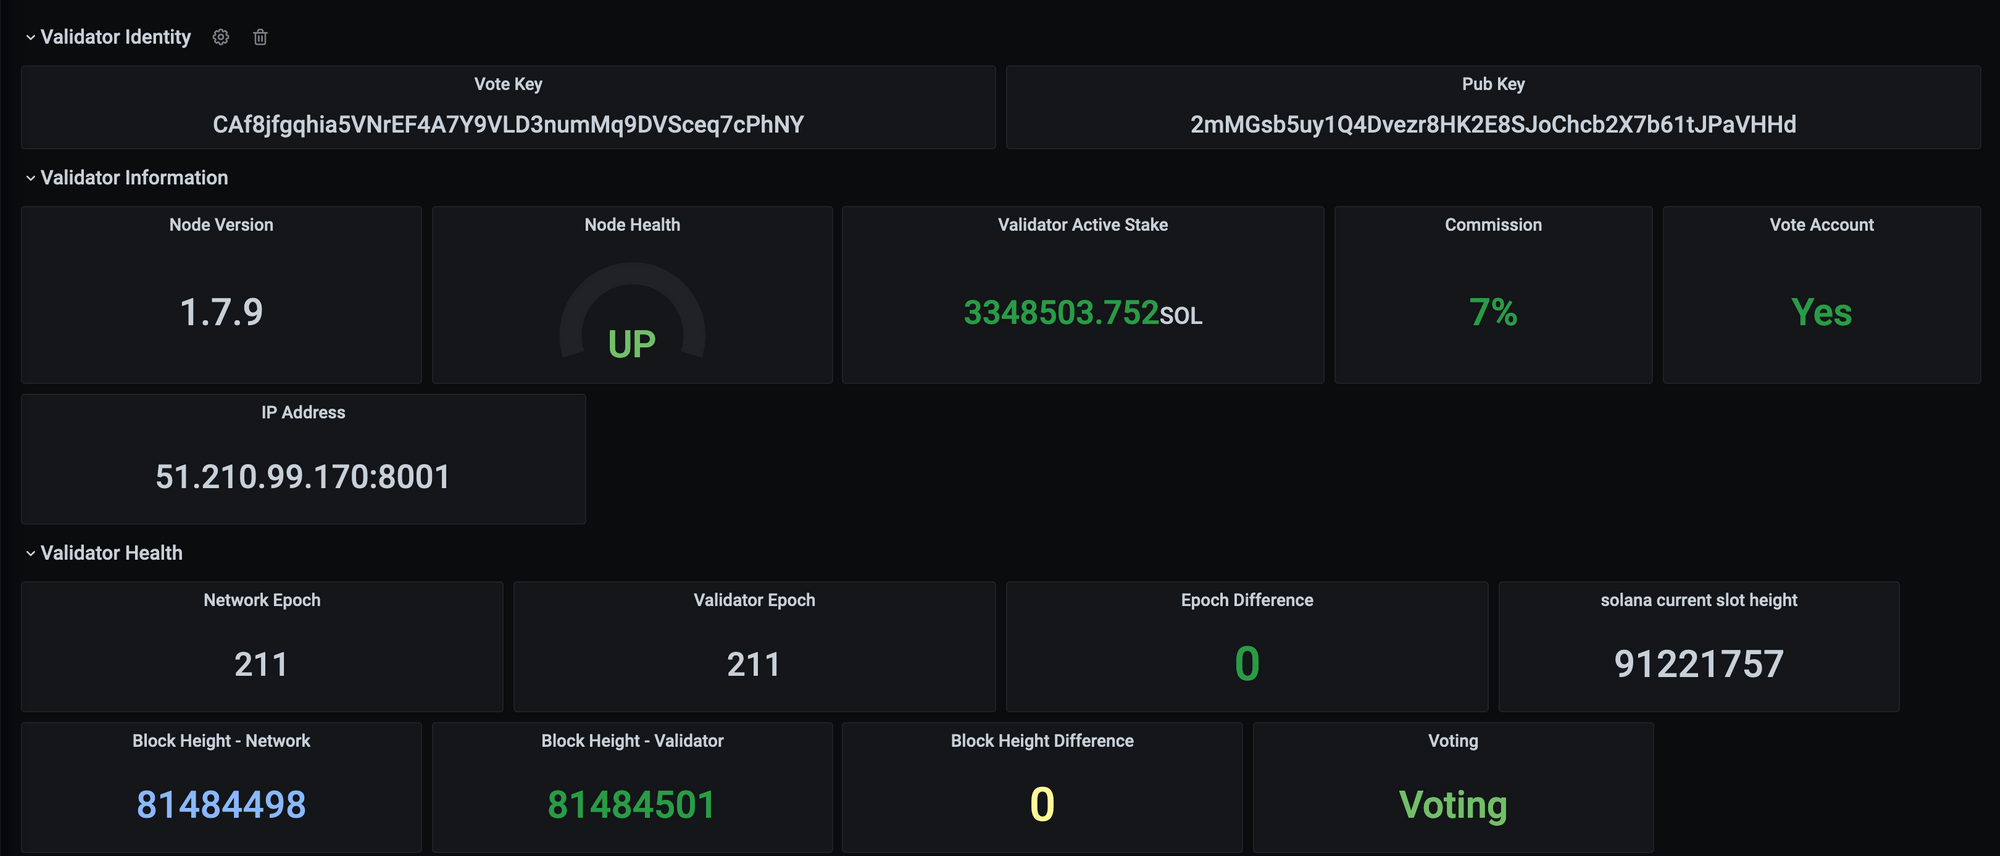

- Validator Identity
- Validator Information, including what Solana version your validator is running
- Validator Health, including whether or not your validator is voting, caught up to the network (epoch and block), skip rate standalone and as compared to the network
- Validator Performance, including vote credits for current and previous epochs, block time, slot tracking, account balances and total network transactions
- Recent Block Production - Current Epoch, including leader slots, total slots, skipped slots and blocks produced
- Extra Information, including slot leader, # of delinquent validators, # of active validators and additional slot information
You can learn how the metrics are calculated here.
3 - System Monitoring Dashboard
This view provides a comprehensive look at system performance metrics, expanding on the summary dashboard, using Node Exporter. Here's you'll find all the system metrics you'd expect to see in a comprehensive system monitoring too
It shows you, among other metrics -
- CPU usage
- Memory usage
- Time synchronization status
- Disk usage
- Network usage
- Process information
- Disk IOPS
- Filesystem stats
Alerting
A custom-built alerting module and Telegram bot complements the dashboards. The module provides configurable alerting that sends various warnings and alarms when the validator begins to experience performance issues.
The alerts are sent to a Telegram bot. Validators can update the code to send the alerts to any other communication channel they prefer.
Validator Mission Control focuses on providing helpful alerts, while not including superfluous alerts that cause unnecessary noise. You can find the code for alerting module here.
The Telegram bot supports a number of different commands as well. Validator operators can use it to receive real-time information about their validator.
Here's the full list of alerts -
- Alert when node health is DOWN.
- Alert when validator is in DELINQUENT state.
- Alert when Block difference meets or exceedes block_diff_threshold which is user configured in config.toml.
- Alert when Epoch difference reaches or exceedes epoch_diff_threshold which is user configured in config.toml.
- Alert when account balance drops below account_bal_threshold which is user configured in config.toml.
- Alert if validator skip rate exceeds network skip rate.
Here's the full list of Telegram bot commands -
- /list - list out the available commands.
- /status - status command returns validator status, current block height and network block height.
- /node - return sync status.
- /balance - returns the current balance of your account.
- /epoch - returns current epoch of network and validator.
- /vote_credits - returns vote credits of current and previous epochs.
- /rpc_status - returns the status of validator rpc and network rpc i.e., running or not.
- /skip_rate - returns the skip rate of validator and network.
- /block_production - returns the recent block production details.
- /stop - which panics the running code and also alerts will be stopped.
Responding to the Community
We appreciate the initial feedback provided by the Solana team and the validators who took an early look at Mission Control.
Now that the tool is released, we assume the tool's use will spark additional ideas. An updated tool version will be released, once the community has a chance to try the tool for themselves.
Getting Started
You can find installation and implementation instructions here.
Please address any questions or feedback you may have, including feature requests, by filing a Github issue here or dropping into the Chainflow Telegram group.